

The Crop Water Stress Index (CWSI) is a measure of the relative transpiration rate occurring from a plant at the time of measurement. It is calculated by using a measure of the canopy temperature of a plant (TC) and the Vapor Pressure Deficit (VPD), which is a measurement of the dryness of the air (Jackson et al. 1981). In this work, the energy balance considerations were reviewed to show how the difference between the canopy temperature and air temperature (TC - TA) is related to vapor pressure deficit (VPD) and the flux density of the net radiation (RNET) present a theoretical basis for the CWSI.
It is very well known that evaporation and transpiration are a cooling process. The water changing state from liquid phase to gas, removes an amount of heat (Latent heat of evaporation) from the evaporating surface. The leaves temperature is adjudicated by soil moisture availability in the root zone (water adequacy in the soil porosity) and the plants' prevailing ambient conditions. The CWSI blends the above two factors to give an estimation of the water stress of the crops. The whole concept is based on the assumption that when the soil moisture is being reduced more and more into the root zone, the transpiration is being reduced respectively - consequently, the plant's canopy temperature increases. The opposite happens when the moisture increases in the soil profile.
In the last century, the foliage temperature has been estimated in various ways. In the first works, the meteorological factor was widely disregarded by scientists due to the unavailable appropriate equipment, and thus the measurements were limited.
During the early part of this century, there has been sparring over whether canopy temperatures should be cooler than those of the surrounding air (Air temperature over the crop). The development of Infrared Thermometers technology allowed further investigation into the relationship between air and leaf temperature.
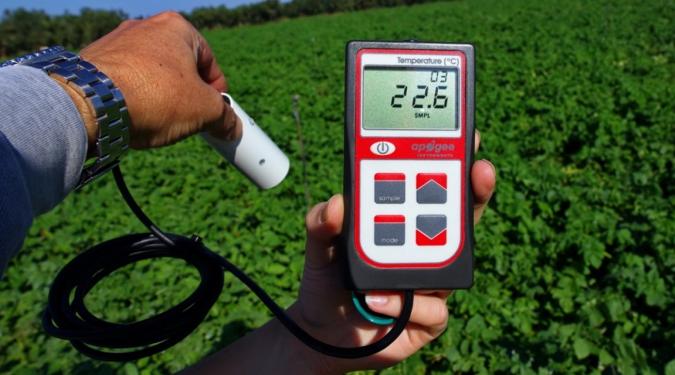
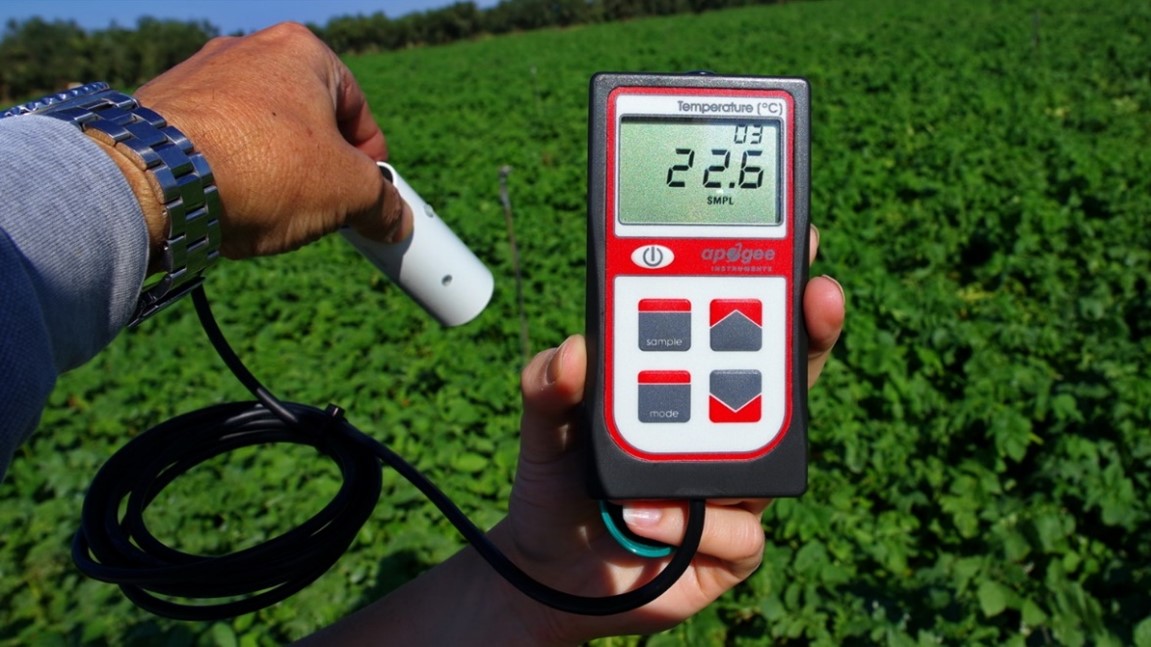
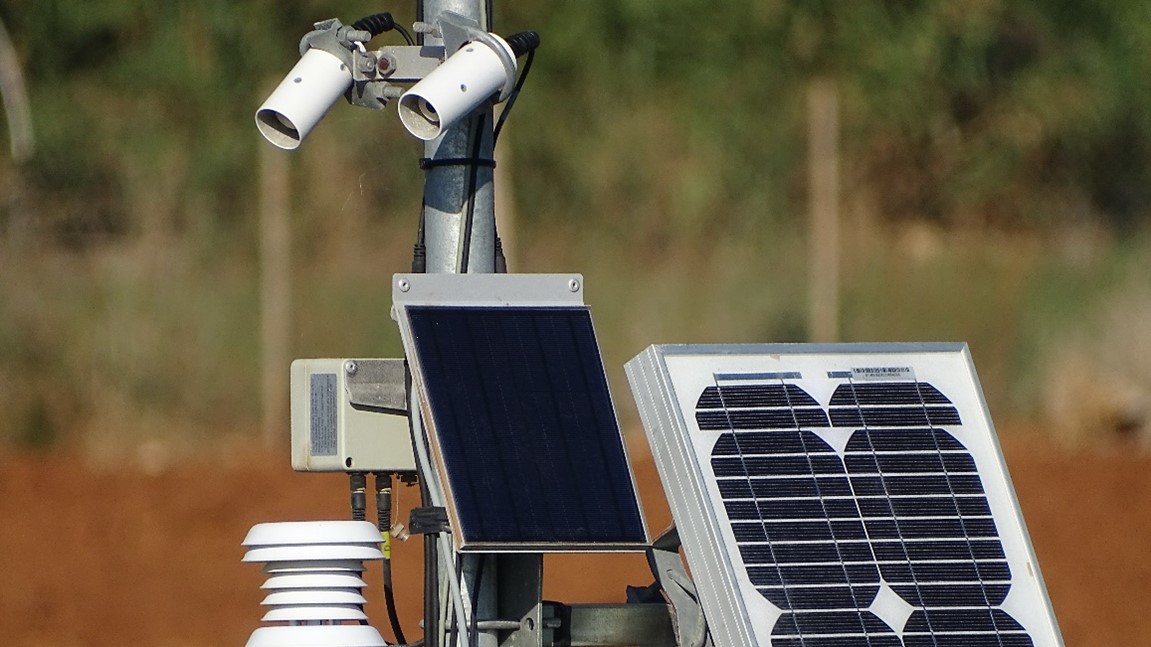
Nowadays, portable Thermometers and auto-logged permanent Infrared measurements (Fig.1,2) are essential sensors for measuring the plant's and soil’s temperature. Infrared thermometry offered the possibility of fast, quantitative measurements of the water adequacy level of plants. Idso et al. (1981) presented an empirical method for quantifying stress by defining "basic lines of stress and fitness for crops”.
Determining the temperature upper line (maximum stress) does not constitute a simple process for any crop. However, this empirical approach has attracted much interest due to its simplicity. It requires measuring canopy temperature (TC), air temperature (TA), and the vapor pressure of the atmosphere's deficit (VPD). After the empirical approach suggested by Idso et al. (1981), a theoretical method for calculating CWSI was presented. The new theoretical procedure required measurement of the net flux density of the radiation (RNET) and an aerodynamic resistance factor, in addition to the air temperature and relative humidity of air required by the empirical approach.
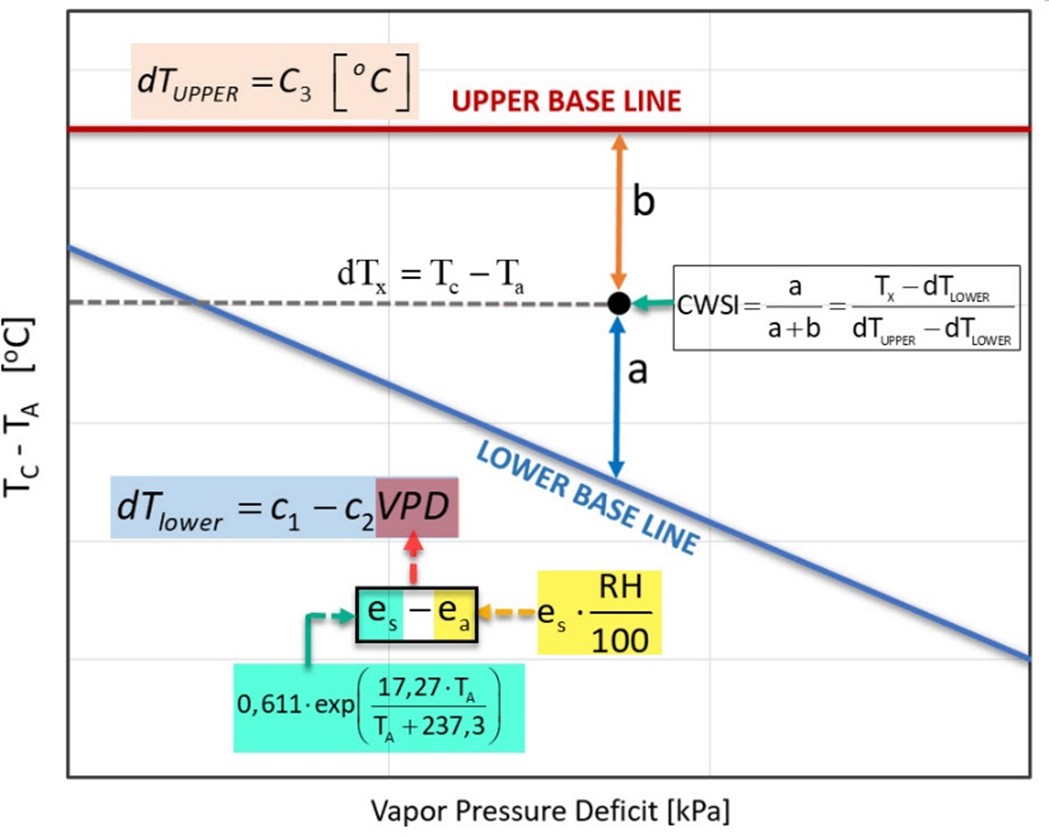
The index's practical estimation is calculated by determining the relative distance between the lower baseline representing the soil water adequacy conditions in the rhizosphere (no stress) and the upper baseline representing the crop's maximum water stress (no transpiration by plants), Fig.3. These two lines are suitable for assessing a crop's water status during the warm seasons of the year where irrigation is required.
These lines are the result of calibration that represents a particular crop in an area. The lowest baseline can be determined by the difference between the crop temperature, the air temperature and the vapor pressure deficit (VPD) measurements, two days after full watering.
The canopy temperature measures must be taken from 10 am to 2 pm, taking a sufficient number of measurements. The canopy's temperature sampling must be repeated several times, including measurements under dry and wet atmospheric conditions. This results in a full range of measures representing the lower regression line for a wide range of value pairs (ΤC-TA vs VPD). The upper baseline determination can be taken after cutting the plant and taking the canopy temperature on the next day, as the plant no longer transpires.
References
- Azzam, A. Tabaileh, T.W. Sammis, D.G. Lugg. 1986. Utilization of thermal infrared thermometry for detection of water stress in spring barley. Agricultural Water Management 12:75-86.
- Idso, S. B., Jackson, R.D., Pinter, P.J.Jr., Reginato, R. J. and Hatfield, J. L. 1981 Normalizing the stress-degree-day parameter for environmental variability. Agric. Metorol., 24:45-55
- Jackson, R. D., Kustas, W. P., & Choudhury, B. J. (1988). A reexamination of the crop water stress index. Irrigation science, 9(4), 309-317.
- Jackson, R. D., S. B. Idso, R. J. Reginato, P. J. Printer, 1981. Canopy temperature as a crop water stress indicator. Water Res 17:1133-1138
- Sammis, T.W. and D. Jernigan.1992. Crop water stress index of ornamental plants. American Soc. of Agric. Eng., Vol. 8, No. 2
- Sammis, T.W. W.R. Riley, and D.G. Lugg. 1988. Crop water stress index of pecans. Applied Eng. in Agric. 4(1):39-45.