

Irrigation is the main source of water consumption worldwide. Almost 60% of the world's water resources, drawn from surface or underground, are spent on crop irrigation. This percentage in Greece reaches 80-85%. A large part of this amount is lost due to leaks of the irrigation networks, while a large part is wasted due to poor irrigation practices and non-existence of planning. About 40%-60% of irrigation water is spent on network leaks and overflow, deferring from area to area. Irrigation water management falls within the quantitative and qualitative requirements of the European Water Framework Directive [2000/60 / EC], for areas with drought.
In recent decades, various scientific fields have contributed to the research and development of solutions for the efficient management of irrigation water, using methods based on micrometeorological observation and the use of specialized sensors (FAO-ASCE). The results of the methodologies that have been developed, aim to increase the production and quality of agricultural products, and to provide flexible tools for controlling water consumption at local and regional level as well.
The Crop Water Stress Index (CWSI) is a way to quantify the water availability of a crop, through measurements of infrared temperature (IR) of the foliage (canopy), in combination with micrometeorological observations (temperature and relative humidity). The temperature of the canopy is an indicator of the aqueous state of the crop, as the mouths of the foliage close in case of water depletion, causing a decrease in transpiration, and an increase in the temperature of the leaf. On the contrary, an adequate quantity of water in the soil, keeps the mouths open and a strong rate of respiration. As a result, the temperature of the foliage gets dicreased, compares to the atmospheric temperature above the crop.
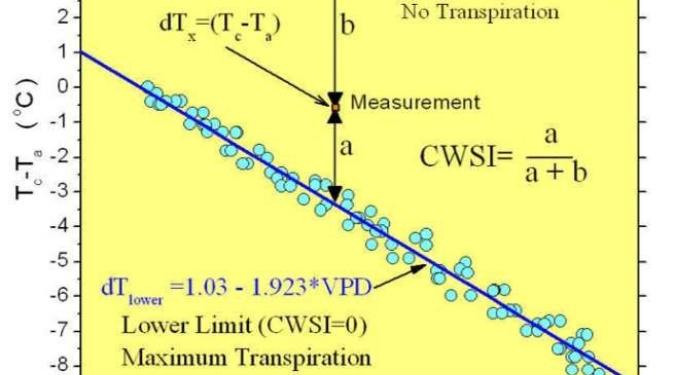
The CWSI is calculated by determining the relative distance between two voltage lines. The first (blue) represents the adequacy of ground water (full transpiration) and the second (red) the lack of ground water (almost zero transpiration). The trend lines represent the difference between the temperature of the foliage in relation to the Vapor Pressure Deficit (VPD) and the air, as shown in the illustration below. 2 stages are required:
- Calibration: experimental data collection on soil moisture, foliage temperature and microenvironmental changes in the crop area, at least for one growing season.
- Use of CWSI to determine the aqueous state of the crop, with accurate measurings of the temperature of the foliage and a thermo-hygrometer.
Temperature measurements of the crop surface (canopy) of a cultivation for the application of CWSI, is currently recognized as an effective way of dynamic management of water resources. Despite the progress that has been made in recent years, it is difficult to measure the interconnection (two-way interaction) of the atmospheric boundary layer over the crop and the canopy in all growing conditions of the crop, except for a few conducive (full sun, hours maximum perspiration), during the growing season.
Modern thermal telemetry techniques related to water consumption are usually limited by atmospheric permeability and lack of sufficient time and spatial analysis (in case of satellite imagery) and by the physical limitations of point observations on the ground (in case of land sensor). In addition, the cost of a permanent installation, operation and maintenance of a land network of infrared sensors, per cultivation, can be prohibitive, on a small and / or large scale.
More precisely:
- Methods based on satellite image analysis are cheaper than conventional ground-based methods. However, they provide a general and low-resolution mapping of the irrigated area, which requires further processing and calibration, without the possibility of direct and accurate quantitative measurement by type of cultivation in an extensive area with different cultivations (failure of 60%). An important disadvantage is the interference of atmospheric conditions, especially clouds, which limit the measurement at the desired time during the growing season. Finally, satellite systems record the thermal radiation in the upper atmosphere which has already passed through it twice and accepted its effect, depending on the wavelength, resulting in a low radiometric resolution. Therefore, the use of satellite methods is limited to large-scale applications, especially cost management and decision-making for water resources in irrigating areas (pumping units for irrigation, monitoring and control of floods).
- Methods based on the installation of land infrared thermometers significantly improve the time and spatial analysis of measurements. However, they require many sensors and supports with permanent installations in the cultivation, as each sensor’s target ideally consists of the plant's breathable leaves, in order to have a representative measurement. Due to the high cost of installation and operation, but also its intervening nature, the land installation of infrared thermometers is limited to a research level, and is mainly applied to crop calibration, to capture the CWSI.
The use of small unmanned aerial systems (UAS) to telescopically capture the state of a crop is a rapidly evolving alternative to already existing satellite and land monitoring systems, regarding the low operating cost and high spatial and time analysis they provide and their flexibility in taking measurements and image. They provide data of high radiometric resolution and clarity due to the low Instantaneous Field of View they have, and the fact that they are not affected by atmospherically effects, as they fly at low altitude. Immediate and accurate spatial recording of temperature gives the advantage of estimating CWSI and the need for real-time irrigation for each calibrated ground cover.